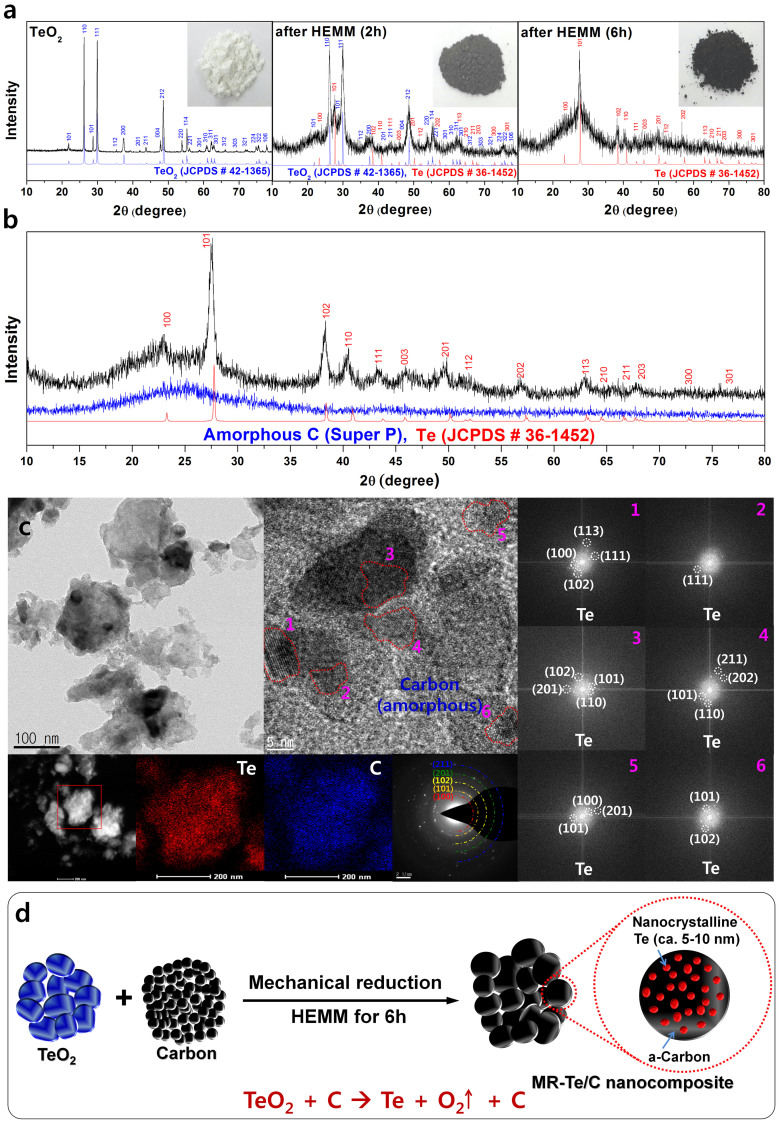
Figure 3. Mechanically reduced Te and its nanocomposite.
(a) XRD results and images of TeO2 powder by HEMM at different milling times. (b) XRD pattern of the MR-Te/C nanocomposite. (c) TEM bright-field image, HRTEM images combined with FT patterns, and STEM image with EDS mapping for the MR-Te/C nanocomposite. (d) Schematic representation of MR-Te/C nanocomposite by the mechanical reduction method.

