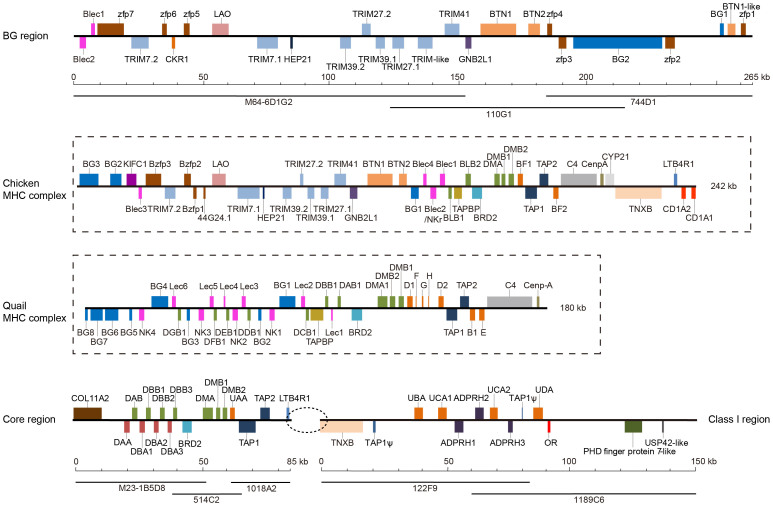
Figure 1. Genomic structure of the crested ibis MHC compared to the chicken and quail MHC-B complexes.
Colored boxes with different sizes show different gene loci of varied sizes, and upper/lower boxes indicate forward/reverse transcript orientations. The dotted oval between the Core and Class I Regions indicates the potential gap. The BACs involved in the minimum tiling path are depicted beneath the genomic maps.

