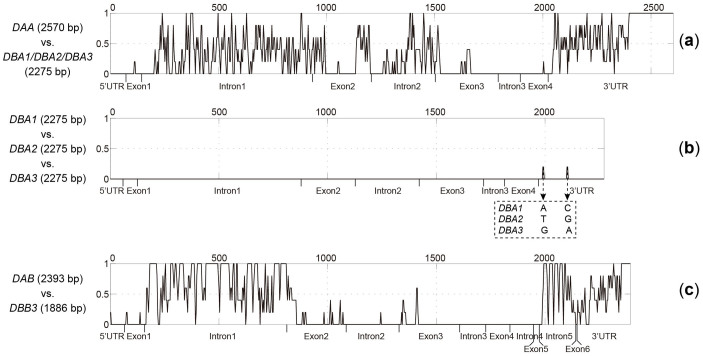
Figure 4. Variation distribution between aligned genomic sequences.
Alignment gaps were considered. For each plot, the sequence length scale (bp) is given on the top, and gene regions are marked at the bottom. (a) Comparison between Nini-DAA and -DBA1/2/3 (nearly identical genes). (b) Comparison among Nini-DBAs 1, 2, and 3. The only two single nucleotide polymorphisms in the 3′UTR are listed below. (c) Comparison between the two most divergent IIβ sequences, Nini-DAB and -DBB3.

