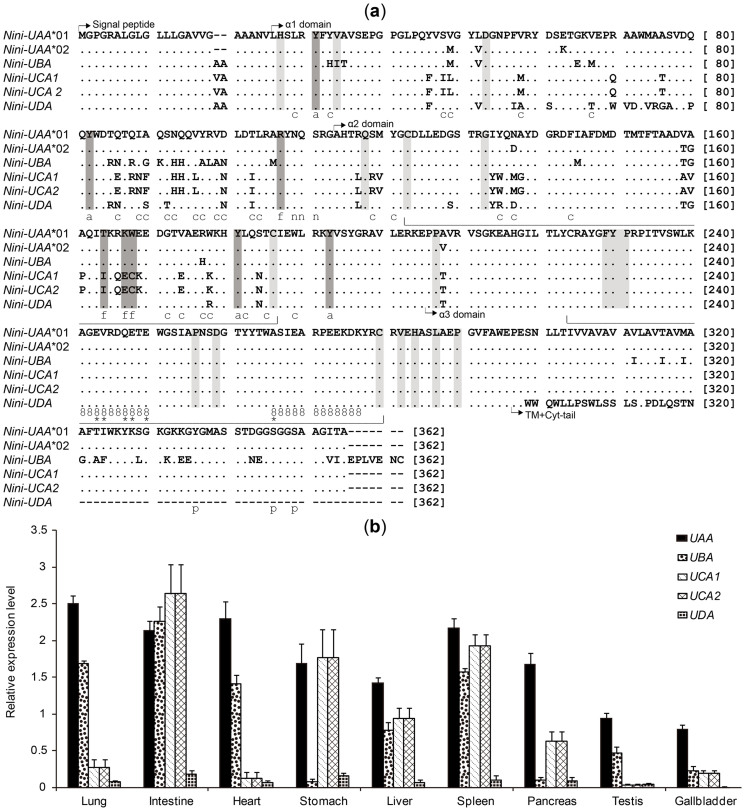
Figure 6. Amino acid alignments (a) and expression levels (b) of Nini-MHC class I genes.
(a) Dots and dashes indicate identities and gaps within the first sequence. Conserved features along sequences are represented as follows: intra- and interdomain contacts (light grey shading), intradomain disulfide bridges (wide bracket), N-glycosylation site (“n”), CD8 binding sites (“8”), essential CD8 co-receptor sites (*), phosphorylated sites in cytoplasmic (cyt)-tail (“p”), antigen-peptide main chain-binding sites (i.e., antigen-binding sites anchoring two ends of peptides) (dark grey shading; “a” or “f” for A or F pocket, respectively)36,37,38,39,41, antigen-peptide non-main chain-binding sites (“c”) (i.e., antigen-binding sites binding the middle segment of peptides)37. (b) Expression levels of the five genes in nine different tissues were examined by qRT-PCR and normalized to the housekeeping gene GAPDH. The relative expression level of the Nini-I genes was calculated using the 2−ΔΔCT method54. The two nearly identical loci, UCA1 and UCA2, were simultaneously amplified using a single set of primers, and the average values were presented herein as the potential expression levels of each gene.

