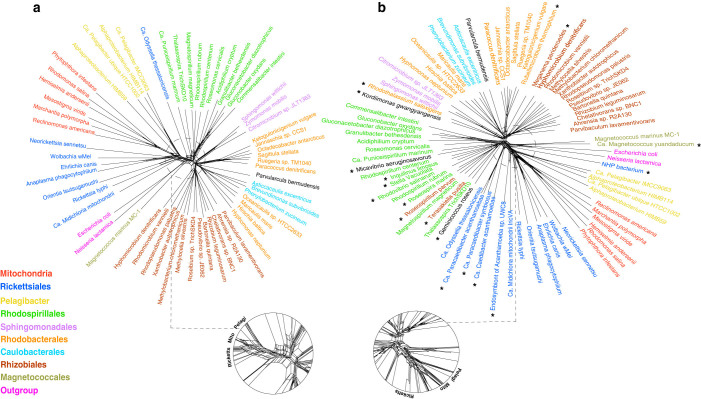
Figure 1. Rooted genome trees of Alphaproteobacteria and mitochondria represented by NeighborNet graphs.
a) Original dataset. b) Original dataset + 18 newly sequenced genomes in this study (denoted with asterisks). Conflicting signal is represented by the network in the graph. The tree is rooted using Beta and Gammaproteobacteria as the outgroup.

