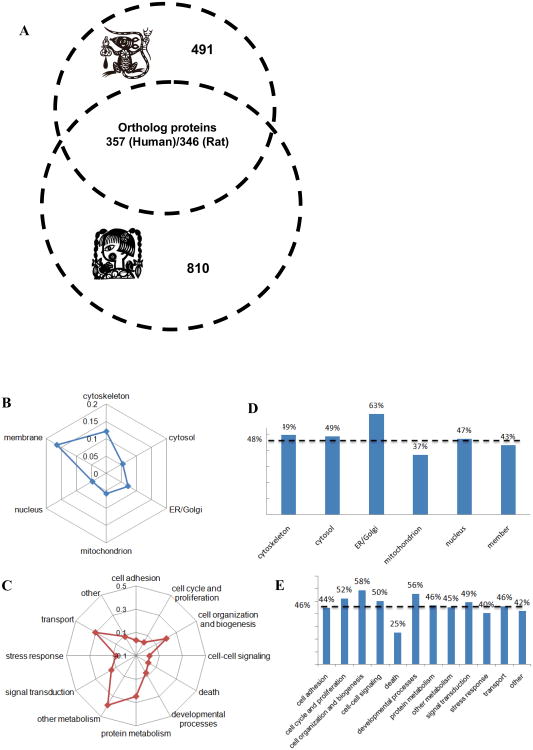
Figure 6. Bioinformatics analysis of orthologous proteins.
(A) The Venn plot (left) demonstrates the orthologous proteins between human and rat platelets. (B, C) All orthologous proteins in rat platelets are classified according to their subcellular localization and molecular functions. (D, E) The histogram demonstrates the ratios of the orthologous proteins in each category versus the overall proteins in the same category. The dotted lines show the average value of the distributions.

