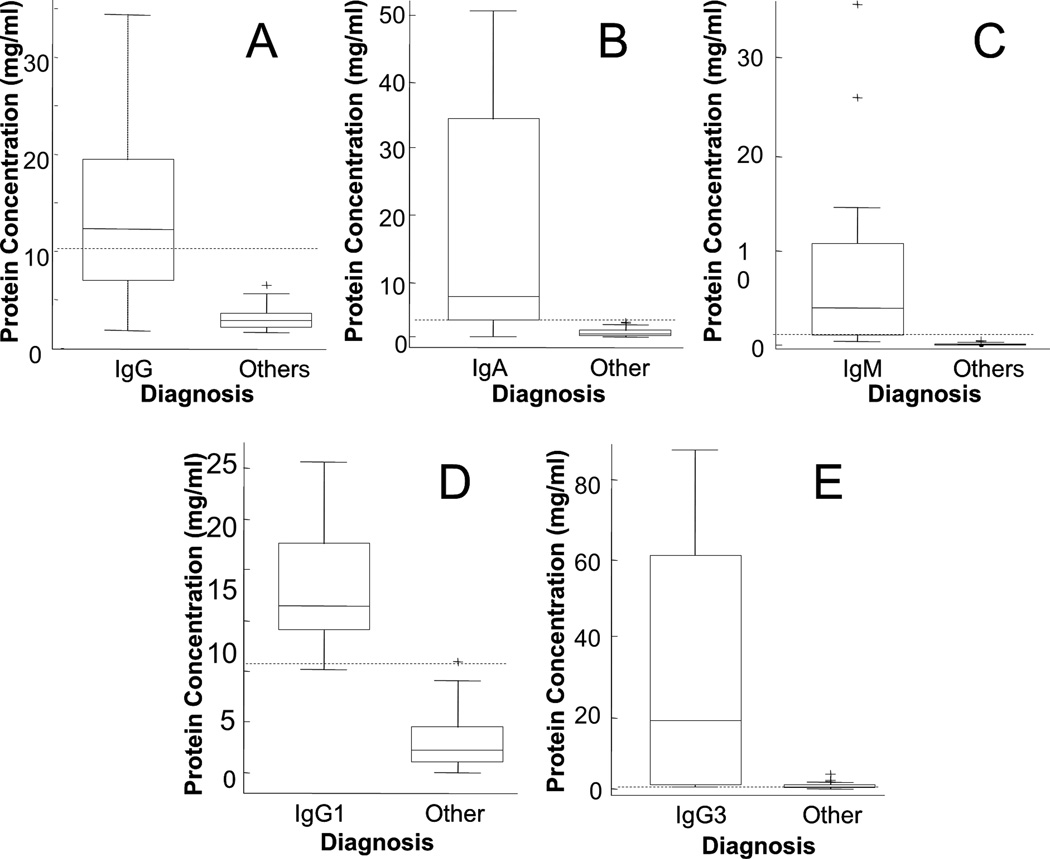
Figure 2. Box plots Comparing Monoclonal Immunoglobulin Expression in Serum for MM Patients with IgG, IgA, and IgM Diagnoses to Other Patients.
Patients with positive diagnosis for specific immunoglobulin types, IgG (A), IgA (B), and IgM (C), are compared with other patients, including both patients not diagnosed with MM and patients diagnosed with MM that express other types of monoclonal immunoglobulins. Data are not included for IgD (n = 5) and IgE (n = 1), because the separation is clear between those patients and the rest of the population. Current clinical measurements are not able to determine the expression of IgG (or IgA) isoforms, but specific peptides from each sequence can be monitored by LC-MRM to differentiate the isoforms of these heavy chains. Patients with each IgG subtype, IgG1 (D) and IgG3 (E) are compared with all other patients in the study. Data are not included for IgA2 (n = 0), IgG2 (n = 2), or IgG4 (n = 1), because the separation is clear between the patients expressing those isoforms and the rest of the population. In each plot, dashed lines indicate the maximum normal immunoglobulin level.

