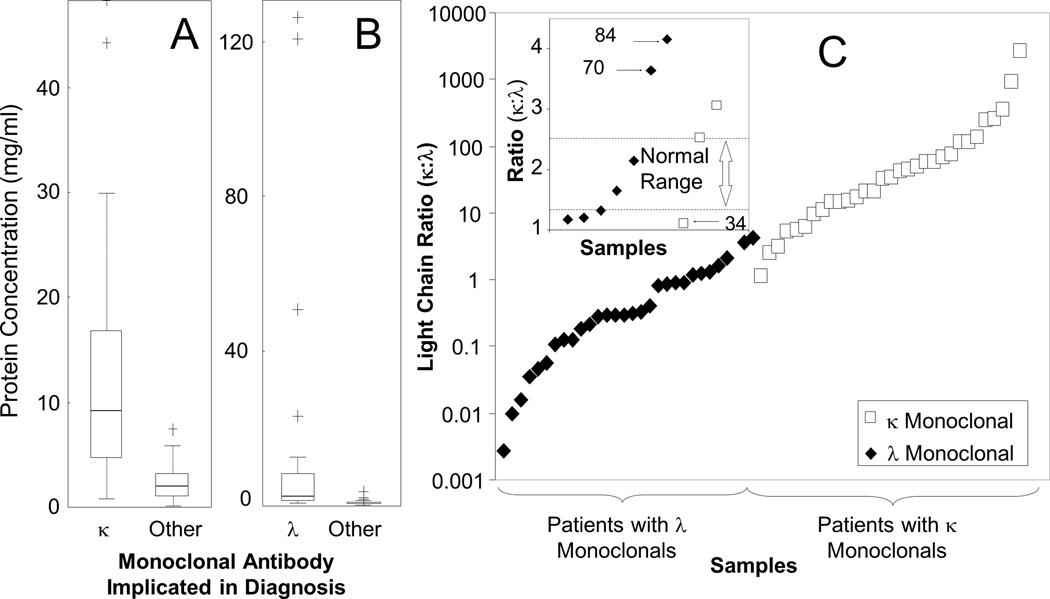
Figure 3. LC-MRM Analysis of Total Light Chain Expression in Serum.
Box plots are shown to compare patients expressing kappa light chain in their monoclonal to other patients (A) and those expressing lambda light chain to other patients (B). Average κ:λ ratios determined from triplicate LC-MRM measurements are also shown for each patient (C), with the exception of 5 patients with κ monoclonals that produced detectable, but not quantifiable, amounts of λ light chain. The normal ratio for total expression of κ:λ light chains in healthy adults (1.3–2.5) [50] is outlined by dotted lines in the inset (C); three patients with low monoclonal immunoglobulin expression had κ:λ ratios on the opposite side of the normal range from the light chain indicated in their diagnosis. In the inset, the numbers are included for reference to the supplemental patient information.

