
Figure 5.
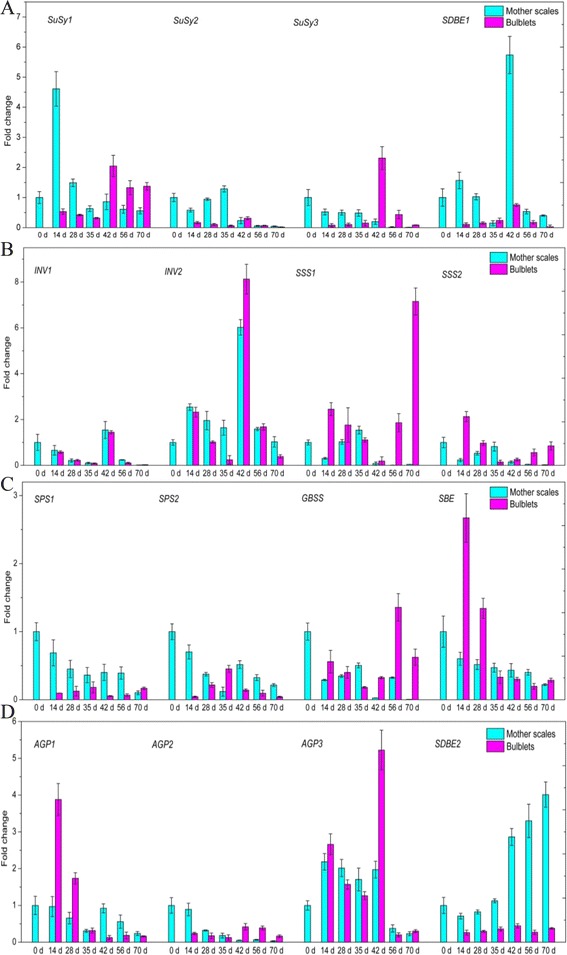
Expression profiles of 16 genes in mother scales and bulblets of L. davidii var. unicolor by the quantitative real-time PCR. Values for quantitative real-time PCR are means ± SE of three replicates. A: Expression profiles of SuSy1, SuSy2, SuSy3 and SDBE1; B: Expression profiles of INV1, INV2, SSS1 and SSS2; C: Expression profiles of SPS1, SPS2, GBSS and SBE; D: Expression profiles of AGP1, AGP2, AGP3 and SDBE2.