
Figure 2.
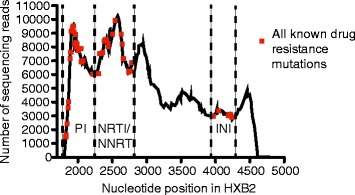
Representative sequence coverage across the pol gene. The number of sequences representing each nucleotide across the pol gene (i.e. “coverage”) is shown for all sites that differed from HXB2 in a representative sample (sample 16 v11). Sites of all known drug resistance mutations are over-layed as red squares and the graph is divided into sections representing mutations associated with protease, reverse transcriptase or integrase drug resistance for reference.