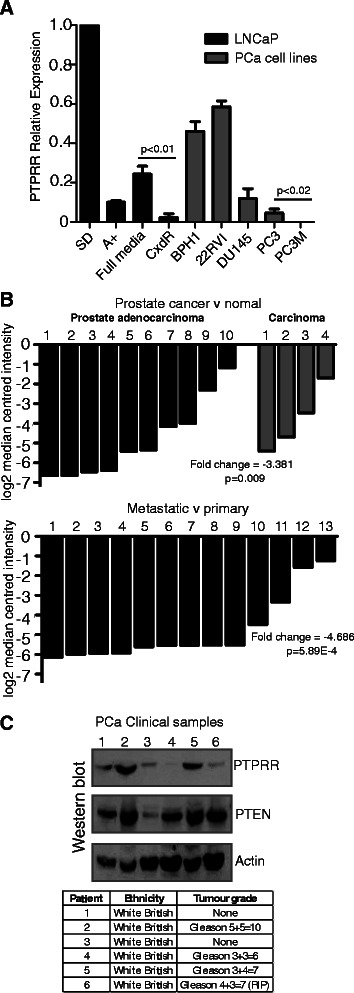
Figure 4.

PTPRRexpression in prostate cancer cell lines and in clinical PCa tissue. (A) Real time PCR analysis of PTPRR expression in 7 prostate cancer cell lines. The LNCaP cell lines used were: androgen responsive LNCaP cells grown in the presence (A+) or absence (SD) of androgens (as described in Figure 1), and in the presence of 10% FBS (full media, FM), androgen insensitive LNCaP cells (AI) grown in charcoal stripped FBS, and Casodex resistant LNCaP cells grown in the presence of 10 μM of the anti-androgen Casodex. The additional cell lines were: benign prostate hyperplasia cells (BPH1), androgen independent CWR22RVI, AR-/ PTEN+ DU145 cells, AR+/PTEN- PC3 cells and their metastatic derivative PC3M. All additional cell lines were grown in 10% FBS. For further details of the cell lines used see Methods. For real-time PCR samples were normalised to 3 housekeeping genes (actin, GAPDH and β-tubulin), and relative to the expression of PTPRR in steroid depleted LNCaP cells. (B) Expression of PTPRR mRNA in prostate cancer clinical samples as measured by Ramaswamy et al. [23,24]. The upper panel shows fold change in 14 prostate cancer tissue samples relative to normal prostate tissue, and the lower panel shows fold change in 13 metastatic samples relative to primary prostate cancer tissue, both measured by Affymetrix Array. (C) Analysis of PTPRR and PTEN protein expression in 6 clinical prostate samples by western blotting. Actin was used as a loading control. The tumour grade and the patient ethnicity for each sample are shown in the table.
