Table 3.
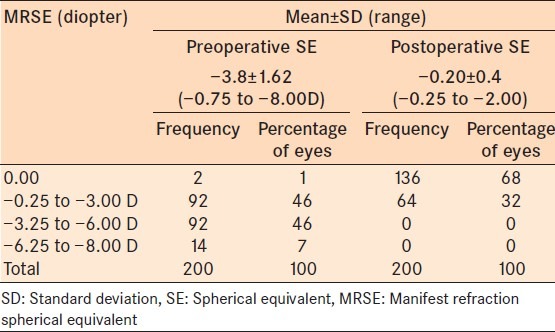
Frequency and percentages distributions of preoperative versus postoperative mean manifest refractive SE of the better eye

Frequency and percentages distributions of preoperative versus postoperative mean manifest refractive SE of the better eye
