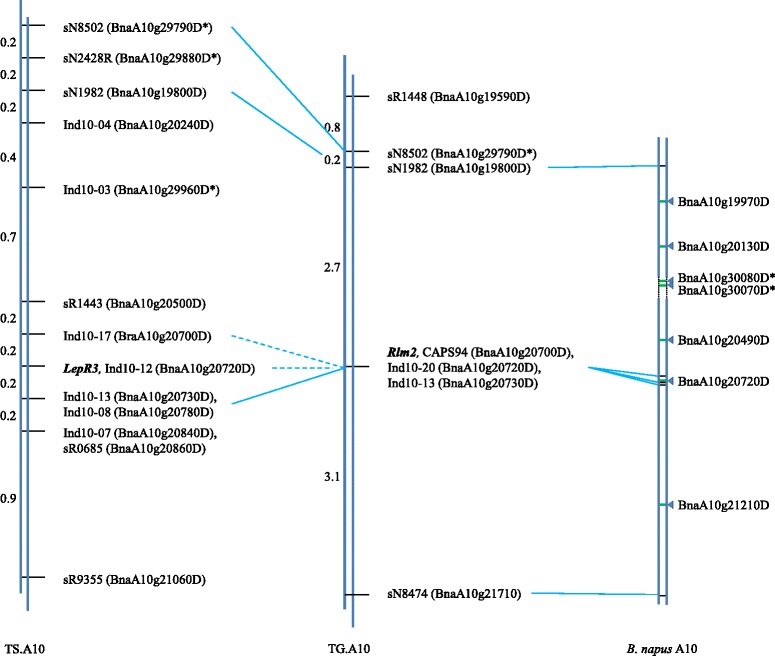
Figure 2.

Comparison of genetic maps for Rlm2 and LepR3 to B. napus chromosome A10. Position of Rlm2 relative to microsatellite (prefixed ‘sN’ or ‘sR’), Indel (prefixed ‘Ind’) and CAPS markers on ‘Topas’ x ‘Glacier’ A10 (TG.A10) map. Nearest B. napus gene to each marker given in brackets. Unanchored B. napus genes corresponding to syntenic B. rapa A10 homologues are denoted with “*”. LepR3 ‘Topas’ x ‘Surpass 400’ A10 (TS.A10) map updated from Larkan et al., 2013a. Marker intervals given in centiMorgans. Solid horizontal lines denote same marker, dashed horizontal lines denote markers sharing same nearest B. napus homologue. Approximate physical location of defense-related candidate genes by triangles. Gap in B. napus A10 chromosome build represented by dotted lines.
