
Figure 4.
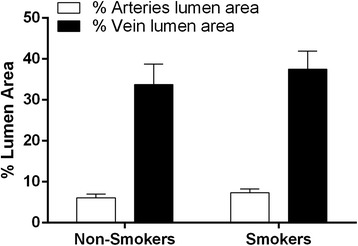
Lumen area analysis. Bar graphs showing percentage of cross-sectional luminal areas of arteries (white bars) and veins (black bars) from the umbilical cord of the non-smokers group (n = 10) and the smokers group (n = 12). The values are presented as means ± SEM.