Figure 2.

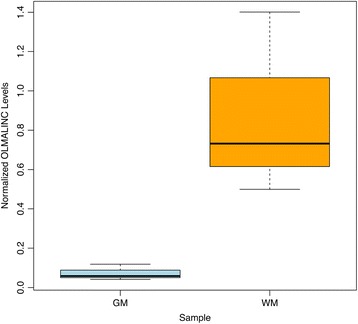
RT-qPCR validation of the OLMALINC gene expression patterns in GM and WM samples. This boxplot shows OLMALINC was up-regulated 12.05-fold in WM when compared to GM (p-value < 0.05).

RT-qPCR validation of the OLMALINC gene expression patterns in GM and WM samples. This boxplot shows OLMALINC was up-regulated 12.05-fold in WM when compared to GM (p-value < 0.05).