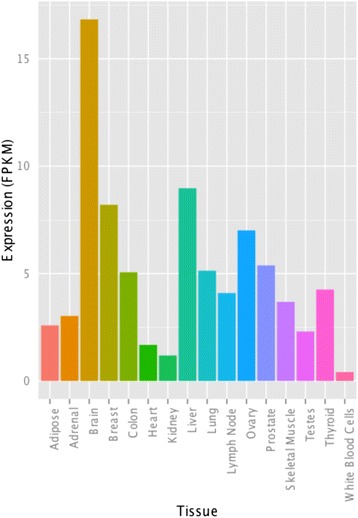
Figure 4.

Comparative analysis of the OLMALINC expression levels in brain and 15 other human tissues. The bar graph shows the difference in expression levels of OLMALINC in varying tissues compared to the brain. The RNA-Seq datasets used for this analysis were taken from Illumina’s BodyMap2 project. The brain has at least a greater than 1.9x expression level of OLMALINC than any other tissue. The y-axis is expression in fpkm.
