Figure 5.

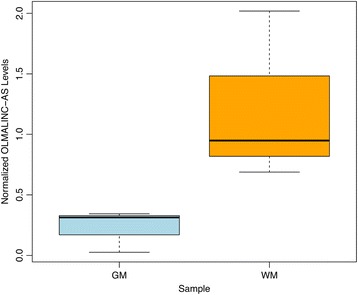
Quantification of OLMALINC-AS in GM and WM of the frontal cortex. This boxplot shows OLMALINC-AS was up-regulated 11.7-fold in WM (p-value = 0.07).

Quantification of OLMALINC-AS in GM and WM of the frontal cortex. This boxplot shows OLMALINC-AS was up-regulated 11.7-fold in WM (p-value = 0.07).