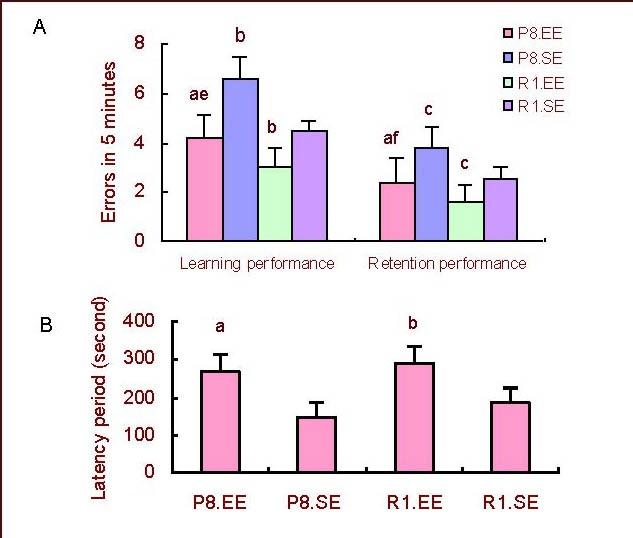
Figure 3.

Comparison of learning and retention performance in the step-down avoidance experiment.
(A) Errors; (B) Latencies. aP < 0.01, vs. P8.SE; bP < 0.01, cP < 0.05, vs. R1.SE; eP < 0.01, fP < 0.05, vs. R1.EE. The data are presented as mean ± SD. Differences between the groups were analyzed using analysis of variance and paired t-tests.
P8: Senescence-accelerated prone mouse 8; R1: senescence accelerated-resistant mouse 1; EE: enriched environment; SE: standard environment.
