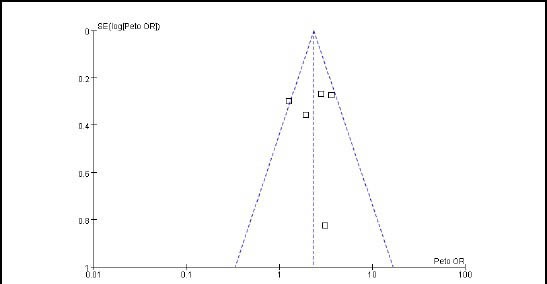
Figure 6.

Funnel plot of topiramate 200 mg/d vs. placebo for responder rate.
X-axis: Log odds ratios (ORs); Y-axis: 1/standard error (log ORs).

Funnel plot of topiramate 200 mg/d vs. placebo for responder rate.
X-axis: Log odds ratios (ORs); Y-axis: 1/standard error (log ORs).