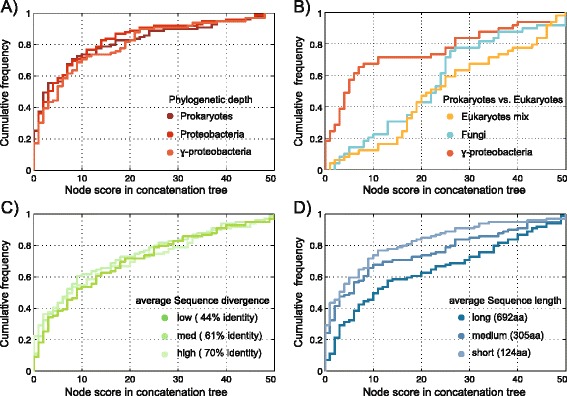
Figure 3.

Parameters influencing node score in concatenated trees and single gene trees. Nodes from concatenated trees were plotted according to their support level compared to single gene trees. All datasets based on 50 single gene trees, except in A), there are only 48 genes. A) Comparisons of the support level at different phylogenetic depths: prokaryotes, proteobacteria, gammaproteobacteria. B) Comparison of the support level for two eukaryotic and one prokaryotic dataset (all datasets, prokaryotic and eukaryotic, consists of 50 taxa), where the underlying single gene trees have similar average sequence length: Eukaryotes mixed: 438 ± 96 aa, Fungi: 441 ± 45 aa, gammaproteobacteria: 441 ± 57aa C) Comparison of the support level at different pairwise identity levels. Values are average percent identities in all pairwise sequence comparisons. D) Comparison of the node score for different average sequence lengths. Values are the average length of all protein sequences in each set.
