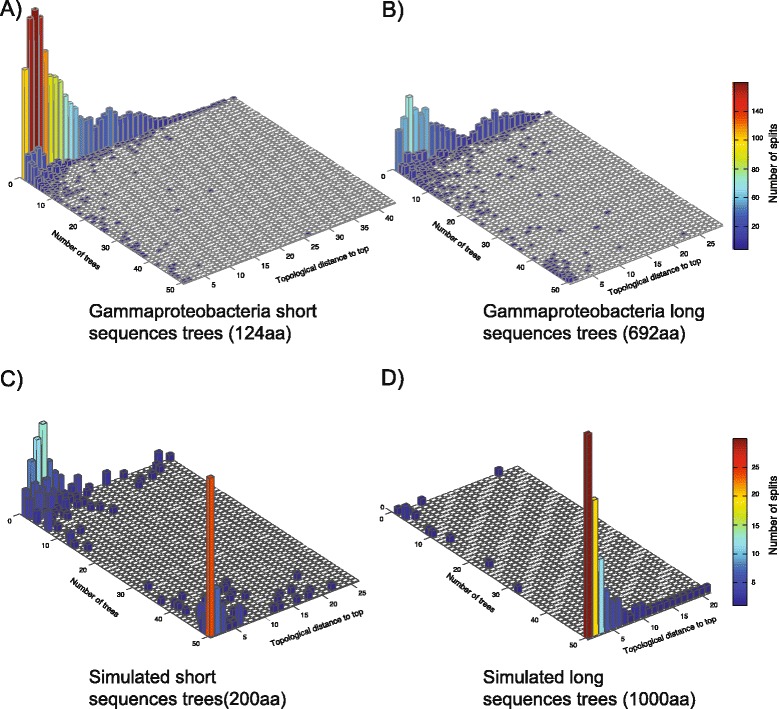
Figure 5.

Splits distribution in single gene data sets for real and simulated data. For each data set all splits within single gene trees were plotted according to their topological distance to the tips of the tree and the number of trees where they are present. A) Dataset of 50 short gammaproteobacteria genes. B) Dataset of 50 long gammaproteobacteria genes. C) Simulated dataset with initial sequence length of 200 positions. D) Simulated dataset with initial sequence length of 1000 positions.
