Figure 3.

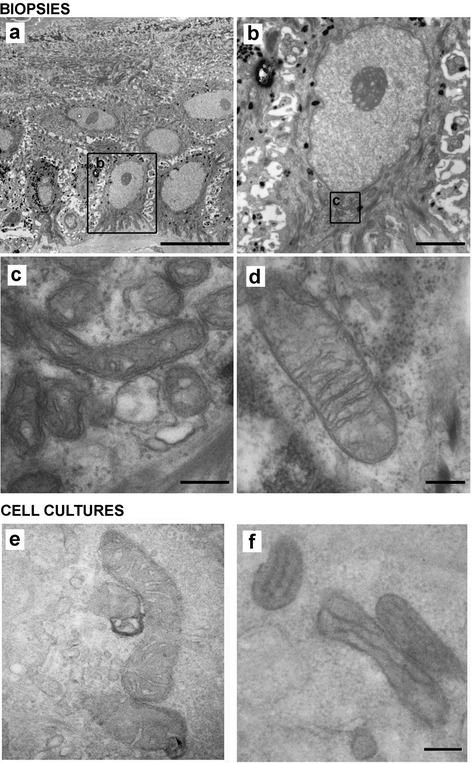
Mitochondrial ultrastructure in KS. Keratinocytes from skin biopsies and cultured keratinocytes from control and KS patients were studied by electron microscopy (EM). (a) Panoramic view of the basal stratum from SK3 patient. (b) Detail of a keratinocyte (squared region in a). (c) Mitochondria from patient SK3 (squared in b). (d) Mitochondria from a control sample. (e,f) EM photomicrographs of mitochondria from control (e) and from patient SK1 (f) cultured keratinocytes. Scale bars: 10 μm (a), 2 μm (b), 200 nm (c, d, e, f). Images shown are representative of each experimental group.
