
Figure 3.
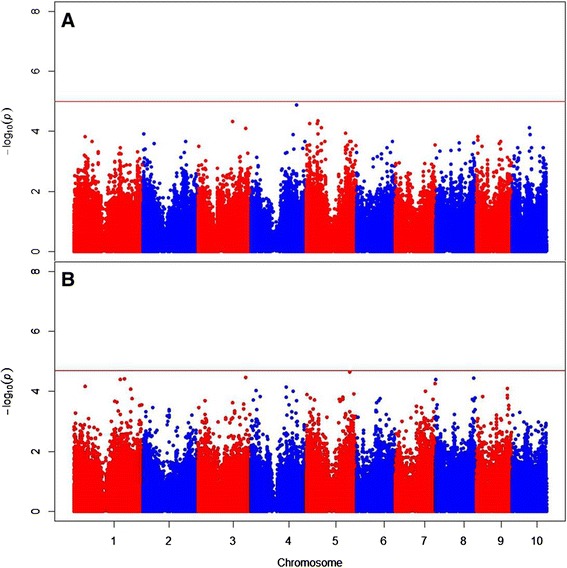
Manhattan plots showing significant associations (points above the red FDR = 0.20 threshold lines) from the B47 topcross (A) and PHZ51 topcross (B) GWAS analyses. The vertical axis indicates –log10 of P-value scores, and the horizontal axis indicates chromosomes and physical position of SNPs.