
Figure 3.
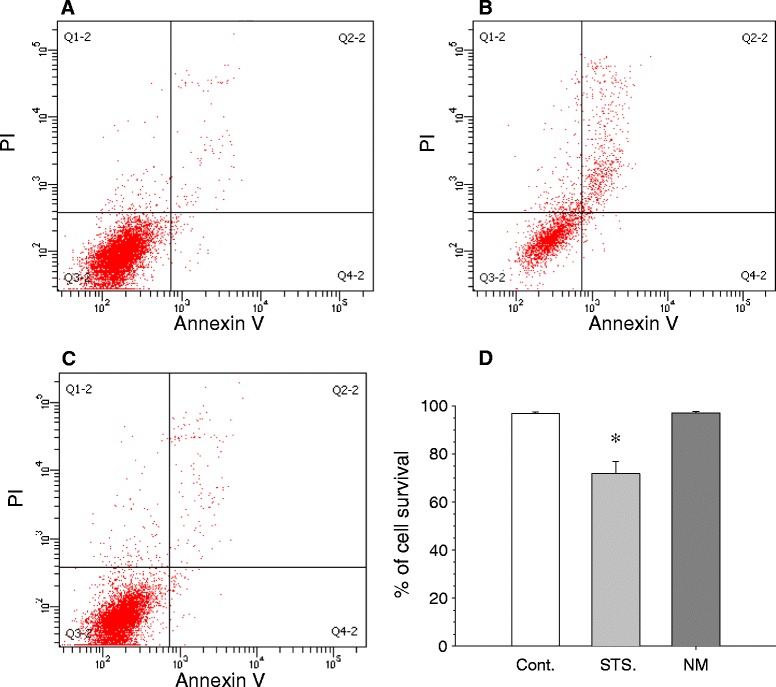
Flow-cytometric analysis of BV2 cell viability. Cells were analyzed using propidium iodide and annexin V. (A) Control cells. (B) Staurosporine (1 μM for 12 h, as death control). (C) BV2 cells + 1 μg/ml of neuromelanin for 24 h. (D) Quantification of cell survival. Results are mean ± standard deviation of three independent experiments, and are expressed as percentage of control values. Statistical analysis was made using Student’s t test. *, P < 0.01 compared with control values. Cont., control; NM, neuromelanin; PI, propidium iodide; STS, staurosporine.