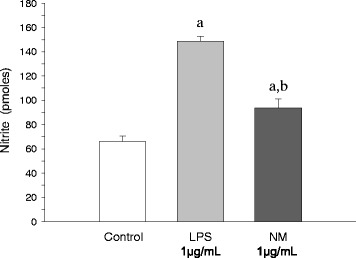
Figure 5.

Activation of nitric oxide production by neuromelanin. Results are mean ± standard deviation of three independent experiments, and are expressed as pmol of nitrite. Statistical analysis: one-way ANOVA followed by the least significant difference post-hoc test for multiple comparisons. α = 0.05 was used. F (2,8) = 168.02, P < 0.01. All treatments are statistically different from each other.
