
Figure 9.
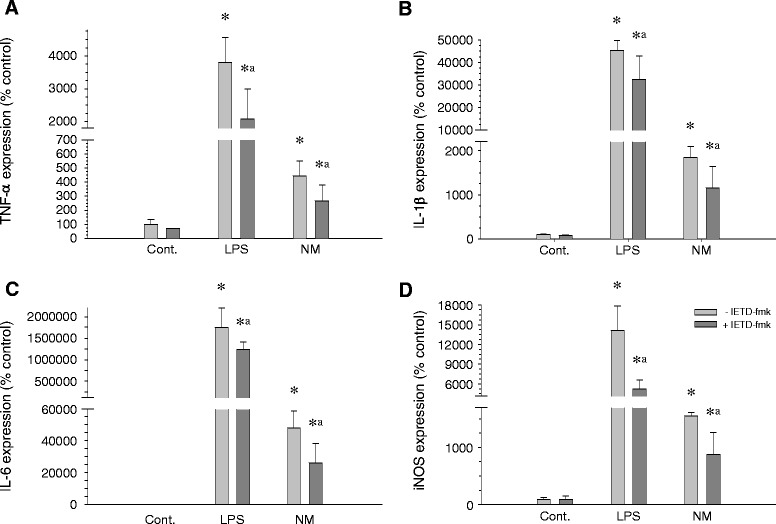
Induction of proinflammatory factors after 24 h of exposure to neuromelanin. mRNA expression was quantified by real-time RT-PCR 24 h after the start of the experiments. (A) TNF-α. (B) IL-1β. (C) IL-6. (D) iNOS. Results are mean ± standard deviation of three independent experiments, and are expressed as percentage of control values. Statistical analysis: one-way ANOVA followed by the least significant difference post-hoc test for multiple comparisons. α = 0.05 was used. *, compared with control value, P < 0.01; a, compared with the same treatment without the inhibitor IETD-fmk, P < 0.01. LPS, lipopolysaccharide; NM, neuromelanin.