Fig. 3.

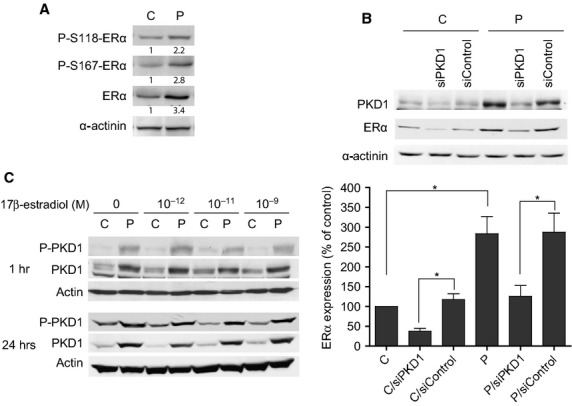
PKD1 enhances ERα expression in MCF-7 cells. (A) Control (C) and PKD1-overexpressing (P) MCF-7 cells cultured in estrogen-free medium were lysed and proteins analysed by western blot by using anti-phospho-ERα(S118) (P-S118-ERα), anti-phospho-ERα(S167) (P-S167-ERα), anti-ERα or anti-α-actinin antibodies. Values presented under each autoradiogram represent quantitative analysis of each band in fold increase compared to C cells. The results presented are those of typical experiments. (B) Control (C) and PKD1-overexpressing (P) MCF-7 cells transfected or not with siPKD1 or siControl were cultured for 3 days in estrogen-free medium and then analysed by western blot for PKD1, ERα and α-actinin expression. The autoradiograms presented are those of a typical experiment. The histograms represent quantitative analysis of ERα expression expressed as percentage of ERα expression measured in untreated control cells (C). The results presented are the means ± SEM for five independent experiments. *P < 0.01. (C) PKD1-overexpressing (P) and control (C) MCF-7 cells were stimulated for 1 or 24 hrs with different concentrations of 17β-estradiol. Cells were then lysed and proteins analysed by western blot by using anti-PKD1, anti-phospho-PKD1 or anti-actin antibodies. The results presented are those of a typical experiment.
