
Figure 1.
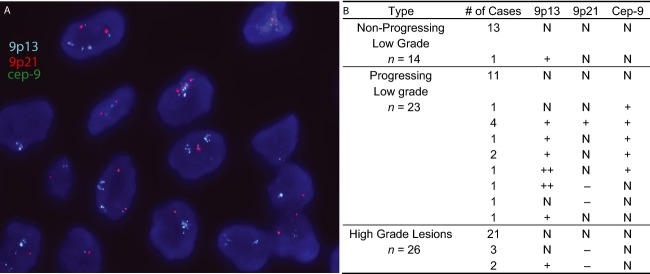
(A) Detection of 9p13 gain using FISH analysis. A representative tissue microarray of a patient with 9p13 (blue) amplification and normal copy number for 9p21 (red) and Cep-9 (green), shown at 60× magnification. (B) 9p13, 9p21, and Cep-9 FISH results of tissue microarrays for 14 nonprogressing low-grade lesion, 23 progressing low-grade lesions, and 26 high-grade lesions. N, normal copy number; +, gain; ++, amplification; −, deletion.