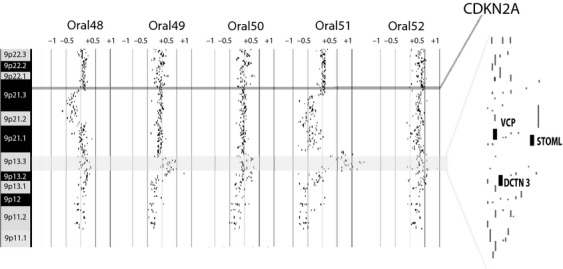
Figure 2.

Alignment of genomic alteration data of five low-grade oral premalignant lesions (OPLs) reveals copy number gain at chromosome 9p13. Log2 signal intensity ratios of each competitive hybridization with normal reference DNA are plotted. Each black dot represents the log2 signal intensity ratio of an individual clone mapping to the array. Sample identifiers are listed at the top of genomic plots. Vertical lines represent log2 signal intensity ratios of +1, +0.5, 0, −0.5, and −1. Horizontally highlighted regions indicate the location of the CDKN2A tumor suppressor gene and the minimal altered region of the 9p13 amplicon. All known RefSeq genes within the minimal region of alteration are indicated on the right. The sizes of the three candidate genes are not drawn to scale.
