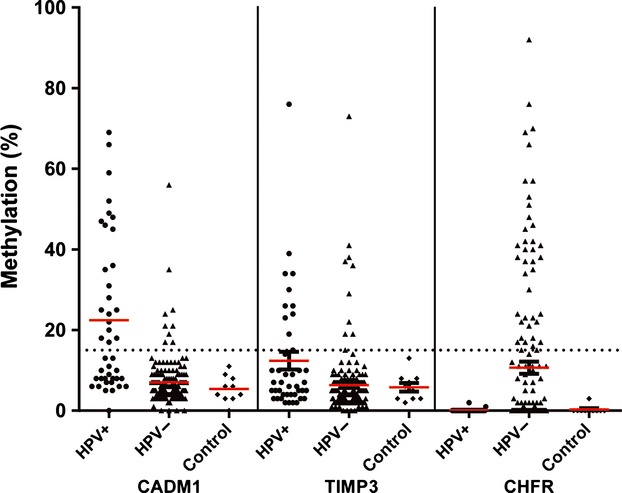
Figure 2.

Extent of methylation of three HPV-related genes in HPV-negative OPSCC (n = 42, filled triangles), HPV-positive OPSCC (n = 158, filled circles), and control tissue (n = 10, filled diamonds) for each sample. Red line: mean value. Dashed line: cutoff value of 15% for promoter hypermethylation.
