
Figure 3.
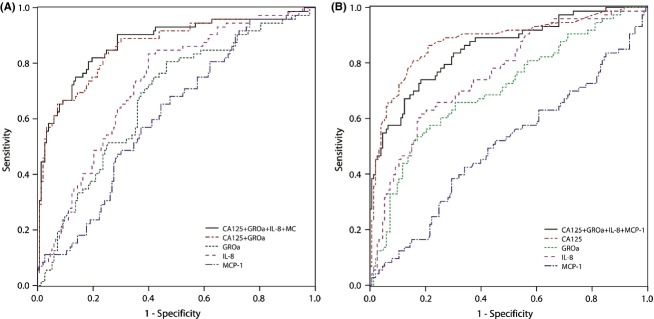
ROC AUC curve for each IL-8, GROα, MCP-1 in (A) ovarian cyst fluid samples, and together with serum CA125 and (B) serum samples. AUC, area under the curve; ROC, receiver operator characteristic; MCP, monocyte chemoattractant protein.
Official websites use .gov
A
.gov website belongs to an official
government organization in the United States.
Secure .gov websites use HTTPS
A lock (
) or https:// means you've safely
connected to the .gov website. Share sensitive
information only on official, secure websites.
ROC AUC curve for each IL-8, GROα, MCP-1 in (A) ovarian cyst fluid samples, and together with serum CA125 and (B) serum samples. AUC, area under the curve; ROC, receiver operator characteristic; MCP, monocyte chemoattractant protein.