Figure 2.

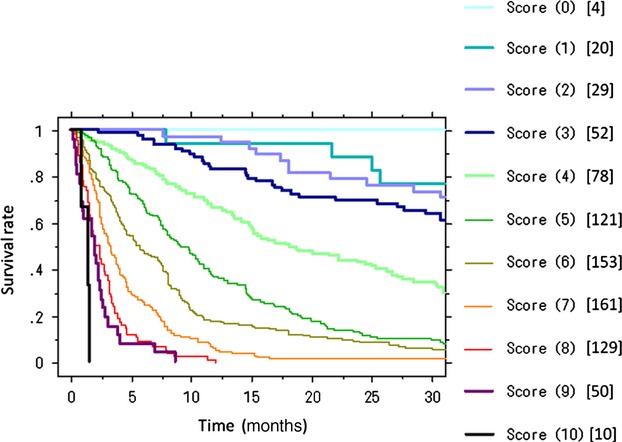
Kaplan–Meier survival curves for different prognostic scores. Values in parentheses and brackets indicate the prognostic scores and the number of patients, respectively. Survival rates deteriorate with increase in the prognostic scores.

Kaplan–Meier survival curves for different prognostic scores. Values in parentheses and brackets indicate the prognostic scores and the number of patients, respectively. Survival rates deteriorate with increase in the prognostic scores.