
Figure 1.
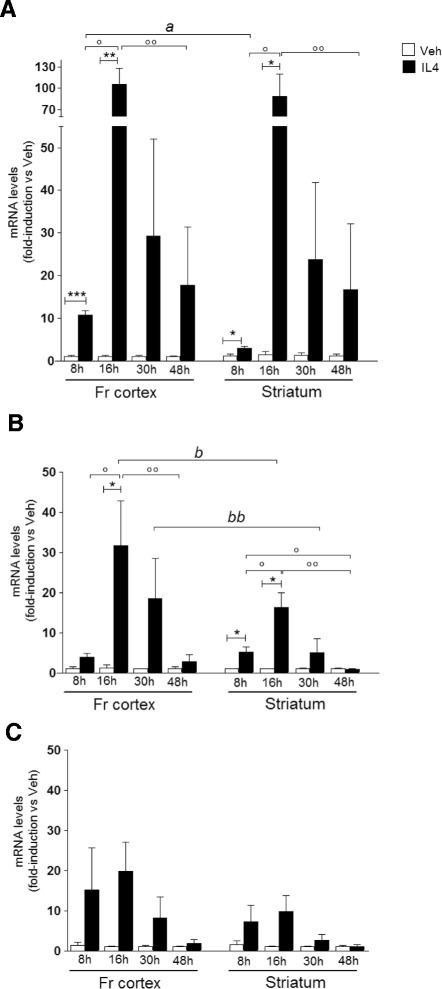
Time course of IL4-induced M2 gene expression in frontal cortex and striatum. Following the indicated time intervals after intracerebroventricular injection of saline (Veh) or IL4, the RNA extracted from the frontal cortex (Fr cortex) and striatum was analyzed by real time PCR to evaluate (A) Fizz1, (B) Arg1, and (C) Ym1 gene expression. Data sets for each gene were calculated using the 2-ddCt method with respect to the mean value of the 8 h vehicle group. Bars represent mean values ± SEM. * P < 0.05 versus Veh; ** P < 0.01; *** P < 0.0005 versus Veh; ° P < 0.05 versus IL4 8 h; °° P < 0.05 versus IL4 16 h (n = 4 to 6); a P < 0.0005 versus striatum 8 h; b P < 0.05 versus striatum 8 h; bb P < 0.05 versus striatum 16 h.