
Figure 3.
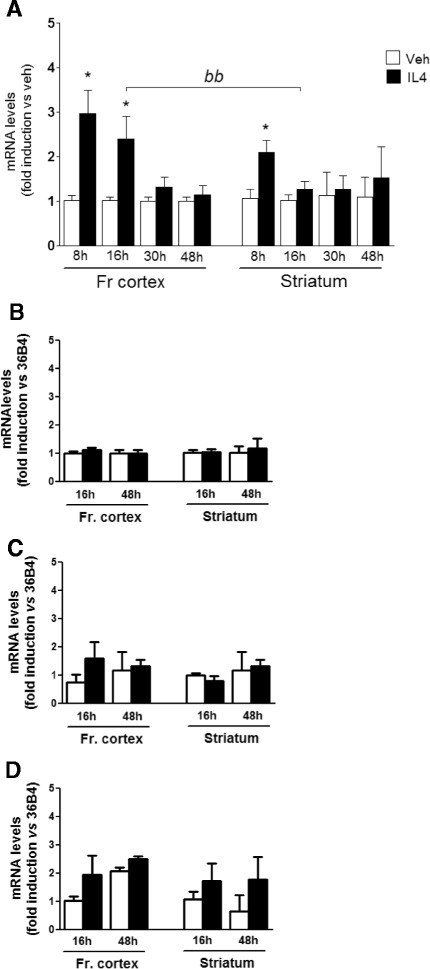
Gene expression of M2a, M2c, and M1 polarization markers. Expression of CD206 (A), TGFβ (B), IL1β (C) and TNFα (D) genes was analyzed by real time PCR on RNA extracted from the frontal cortex (Fr cortex) and striatum of mice treated by intracerebroventricular injection for 16 and 48 h with saline (veh, open bars) or IL4 (black bars), as indicated. Data sets for each gene were calculated with the 2-ddCt method with respect to the mean value of each vehicle group. Bars represent mean values ± SEM. * P < 0.05 versus veh 16 h; bb P < 0.05 versus striatum 16 h (n = 4 to 6).