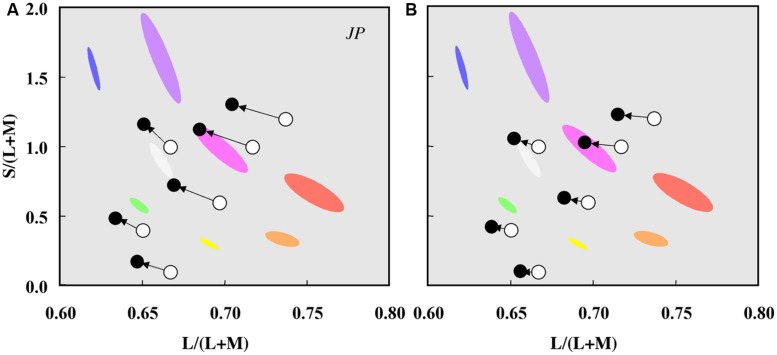
FIGURE 3.
Chromaticity shifts in the color appearance of cone signals due to rod excitation. Data for one observer (JP) plotted in a relative cone Troland space at 2 photopic Td (A) and 10 photopic Td (B). The arrows indicate the effect of increased rod excitation on the direction of the color shift from the stimulus chromaticities (unfilled circles) to the matching chromaticities (filled circles). Ellipses show the chromaticities of eight non-dark appearing basic colors. Adapted from Cao et al. (2005).

