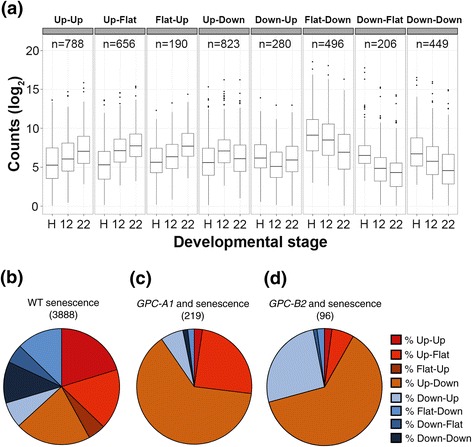
Figure 4.

Expression profiles during senescence. (a) Boxplot of log2 normalized counts for WT samples over three time points during senescence, separated according to their expression profiles in 8 classes. Classes were defined based on the existence of significant (‘Up’ and ‘Down’) or non-significant differences (‘Flat’) between time point comparisons. (b-d) Proportion of expression classes among loci DE during senescence in (b) WT (3888 loci), (c) high-confidence GPC-A1-regulated loci (219 loci) and (d) high-confidence GPC-B2-regulated loci (96 loci). Loci included in C and D are based on the intersections of the three classes shown in Figure 3, c and d. H = Heading Date, 12 = 12 days after anthesis, 22 = 22 days after anthesis.
