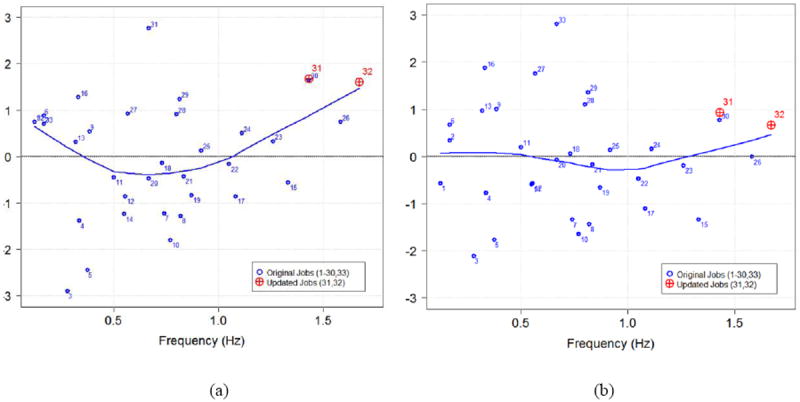
Figure 4.

Residual plot (observed value - predicted value) for the linear model (a) in Equation 2 and the non-linear regression model (b) in Equation 3. The numbers adjacent to data points correspond to the job numbers in Table 2. The curves indicate the trend of the residuals. Ideally these would lie exactly on the residual equal zero line.
