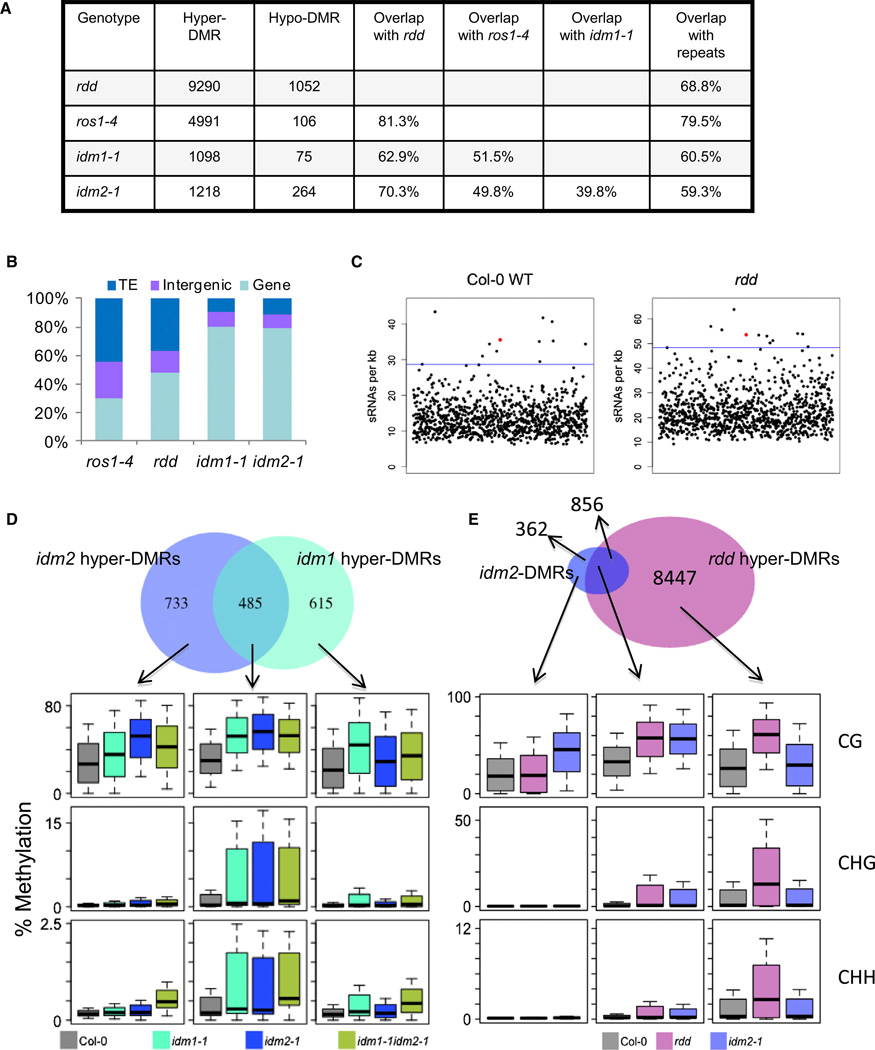
Figure 2. Analysis of DMRs Identified in idm2 Mutant.
(A) The number of DMRs identified in idm2 and the overlap of hyper-DMRs between different mutant plants.
(B) Composition of the hypermethylated loci in idm2-1, idm1-1, ros1-4, and rdd mutants. TE, transposable element.
(C) Enrichment of small RNAs (sRNAs) in the 1,218 hypermethylated regions identified in idm2-1. Small RNA reads were generated from the wild-type and rdd mutant plants by Lister et al. (2008). Black dots indicate the sRNA densities from randomly selected regions in the genome, and red dots indicate the sRNA densities in the hypermethylated regions in idm2-1. Horizontal lines indicate the 99th percentile of sRNA density from 1,000 simulated runs.
(D and E) Overlap of hyper-DMRs between idm2 and idm1 (D) and between idm2 and rdd (E). Boxplots represent methylation levels of each class of DMRs.

