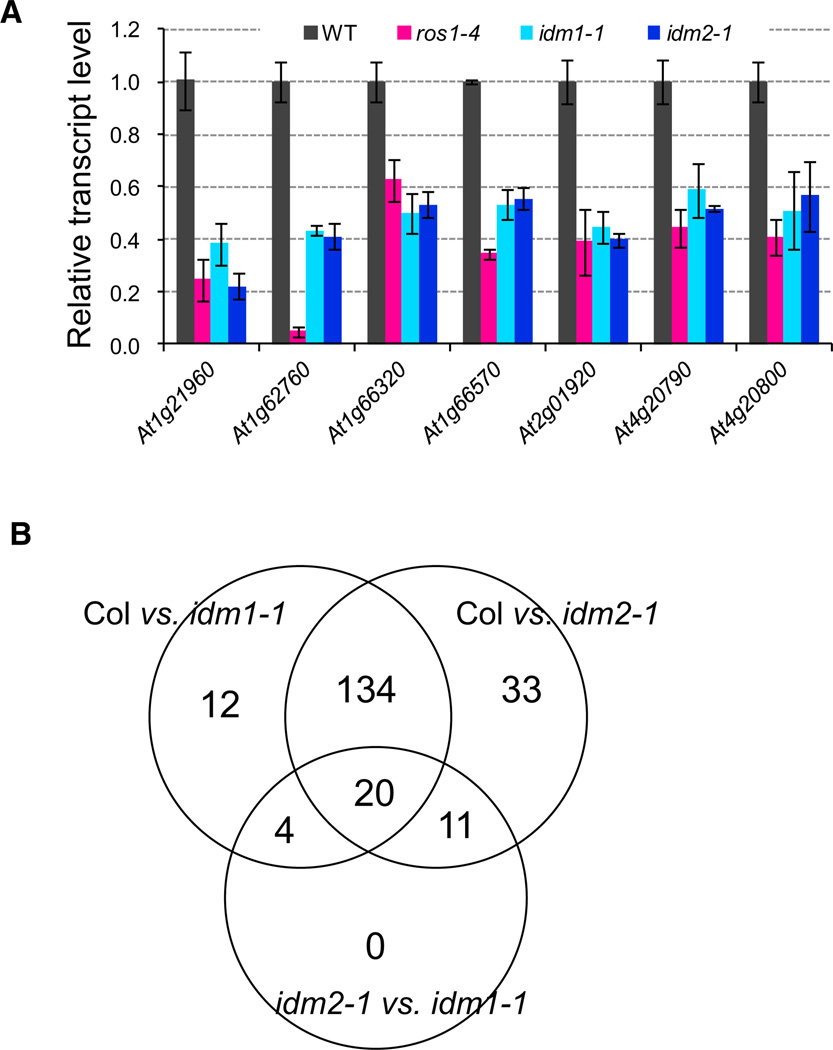
Figure 3. Gene Expression Level in idm1 and idm2 Mutants.
(A) Expression of the hypermethylated genes or genes near DMRs in 2-week-old idm1-1, idm2-1, and ros1-4 seedlings. Error bars represent standard error (n = 3).
(B) Overlap of differentially expressed genes between the different comparison groups.

