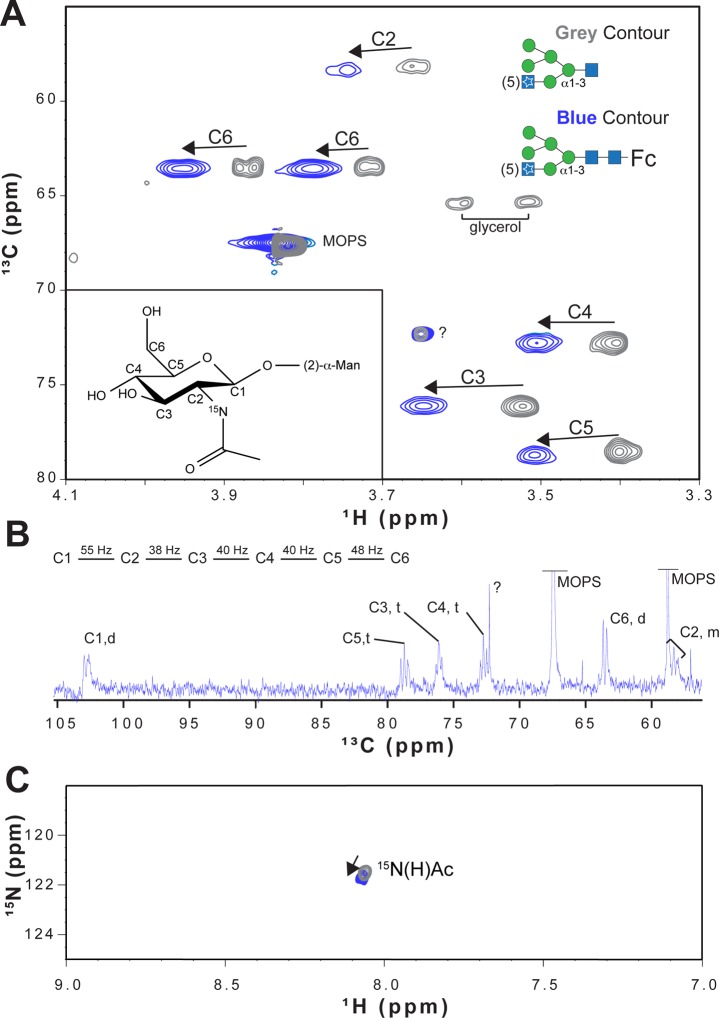
Figure 5.
1H–13C HSQC spectra of IgG1 Fc with a Man5 N-glycan following addition of [13C,15N]GlcNAc. (A) A 2D 1H–13C HSQC spectrum of the *N-Man5 N-glycan following EndoF1-catalyzed hydrolysis is shown as gray contours. Blue contours show the positions of peaks from IgG1 Fc bearing a *N-Man5 N-glycan. Arrows indicate the direction of peak movement because of interactions with the Fc polypeptide. Peak labels that correspond to a figure of β-linked GlcNAc are shown (inset) and refer to the carbon position of the 1H–13C peak. 1JC–C couplings are not resolved because of the limited resolution in the 13C dimension. (B) 1D 13C-observe NMR spectrum of *N-Man5 Fc. 1JC–C values are indicated. (C) 2D 1H–15N HSQC spectra before and after N-glycan hydrolysis with the same colors used in panel A.

