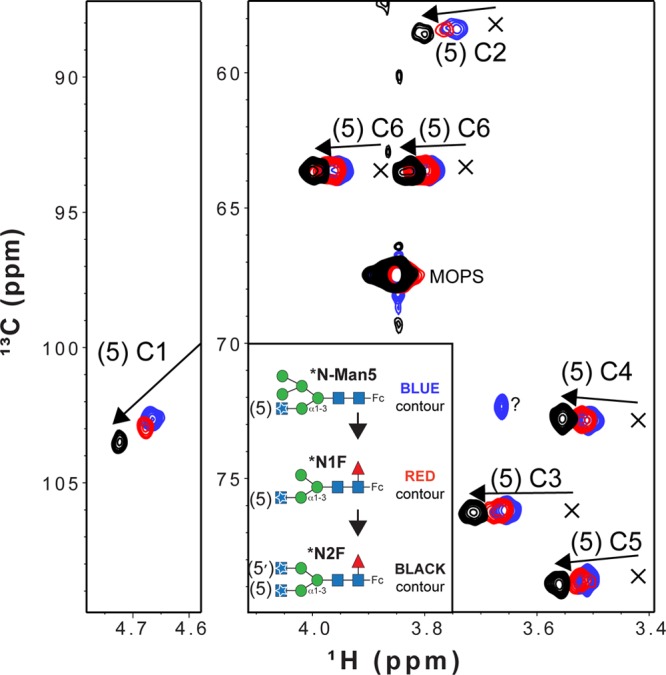
Figure 6.

Overlay of 1H–13C HSQC spectra collected with purified IgG1 Fc glycoforms that reveals shifts of peaks away from that of a hydrolyzed N-glycan. The positions of peaks from an Fc N-glycan following EndoF-catalyzed hydrolysis are indicated with X’s. Arrows show the direction of peak movement as the N-glycan matures. The C1 peak for the hydrolyzed glycan was obscured by residual water in the sample and was not observed.
