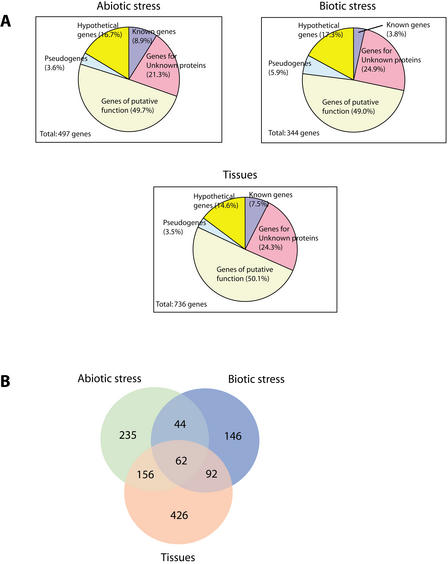
Figure 7.
A comparison of genes found to be significantly regulated in the various experimental subsets. (A) Distribution of role categories for each of the biotic, abiotic, and tissue classes of assays. (B). Venn diagram analysis showing the number of significantly regulated genes overlapping between sets.

