Fig. 8.
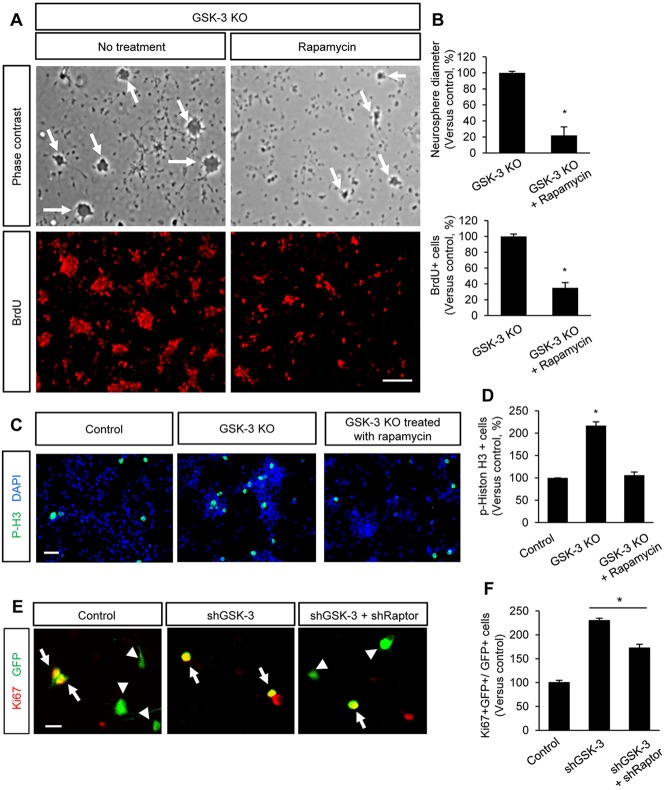
Inhibition of mTOR suppresses proliferation of GSK3-deleted progenitors. (A) Top: dissociated neural progenitors from E13.5 GSK3-deficient mice actively proliferated in culture and formed neurospheres (arrows). Inhibition of mTOR activity by treatment with rapamycin suppressed neurosphere formation in GSK3-deleted progenitor culture. Bottom: GSK3-deleted progenitors were cultured and treated with BrdU. Proliferating cells positive for BrdU were reduced by rapymycin treatment. Scale bar: 80 μm. (B) Neurosphere size was quantified in GSK3-deficient cortical progenitors in the absence or presence of rapamycin. The treatment of GSK3-deleted cells with rapamycin decreased the diameter of neurospheres and the number of BrdU-labeled cells. *P<0.05. Data are mean±s.e.m. (C) Compared with control cells, GSK3-deficient neural progenitors generated more mitotic cells (phospho-histone H3) due to their self-renewal capacity. However, when treated with rapamycin, their proliferation capacity was suppressed. Scale bar: 40 μm. (D) Quantification of phospho-histone H3-positive cells. Control is Gsk3α+/−; Gsk3βloxP/+; Nestin-cre; knockout is Gsk3α−/−; Gsk3βloxP/loxP; Nestin-cre. *P<0.05. Data are mean±s.e.m. (E) Progenitors were transfected with control GFP, shGSK3, or shGSK3 and shRaptor. Transfection of shRaptor suppressed the proliferation of GSK3-deleted cells. Arrows and arrowheads indicate proliferating and non-proliferating cells from a whole transfected cells, respectively. Scale bar: 20 μm. (F) Quantification of E. *P<0.05. Data are mean±s.e.m.

