Fig. 1.
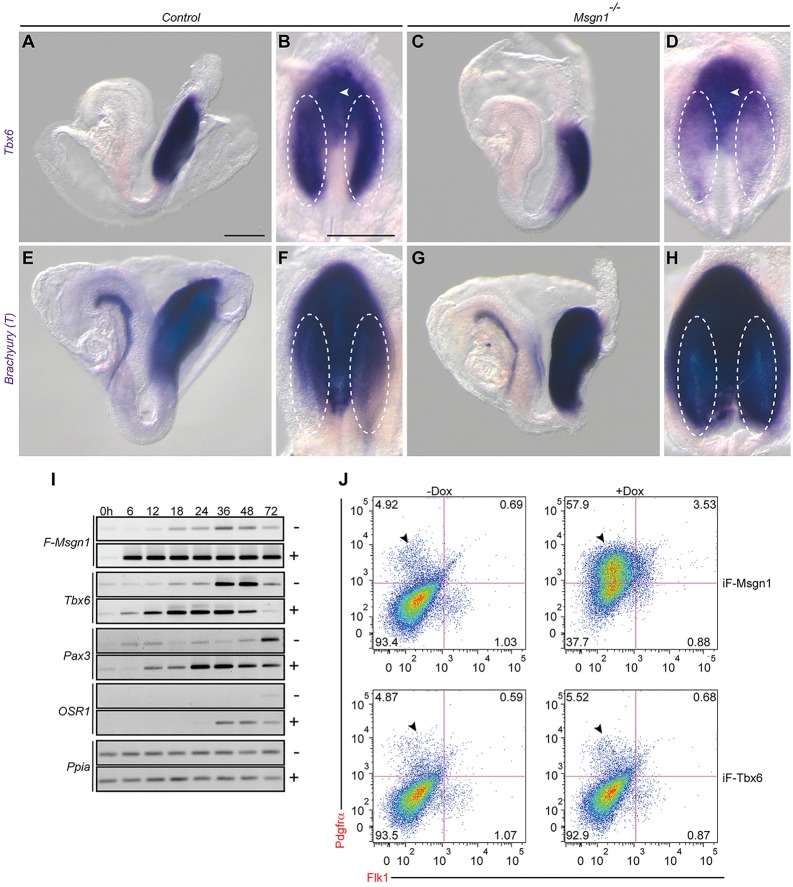
Msgn1 promotes paraxial mesoderm formation. (A-H) WISH analysis of Tbx6 (A-D) and T (E-H) mRNA expression in E8.5 control (A,E, lateral view; B,F ventral view) and Msgn1−/− (C,G, lateral view; D,H, ventral view) embryos. Scale bars: 200 μm. (I) iF-Msgn1 EBs treated with (+) or without (−) Dox from 0-72 h are analyzed for the expression of Tbx6, Pax3 and Osr1 by semi-quantitative RT-PCR. Cyclophilin A (PpiA) is used as a loading control. (J) Density plots of flow cytometry analysis for the expression of Pdgfrα and Flk1 in iF-Msgn1 and iF-Tbx6 EBs treated with (+) or without (−) Dox for 24 h. Numbers indicate the percentage of cells within each quadrant. Arrowheads indicate the section containing Pdgfrα-expressing paraxial mesoderm cells.

