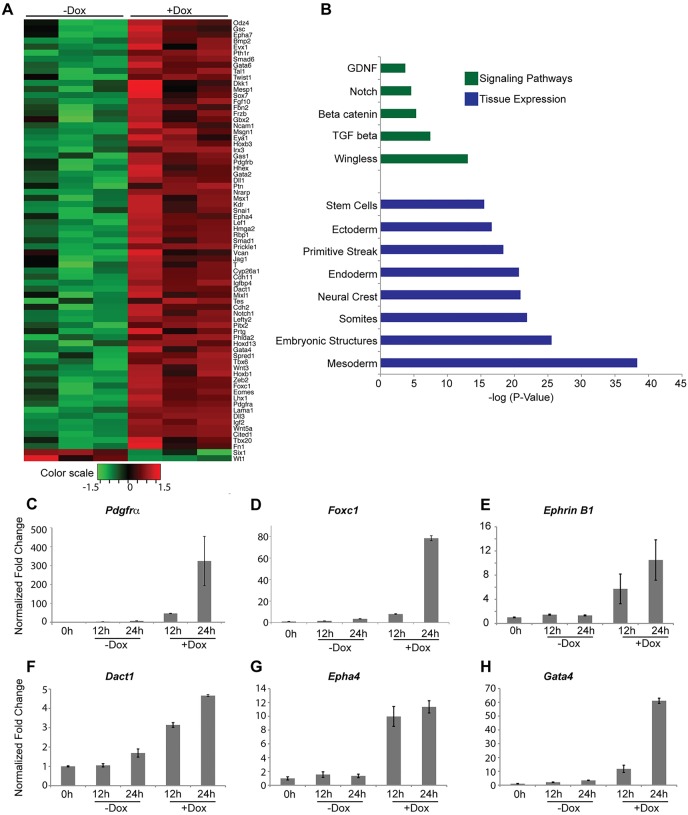
Fig. 2.
Identification of the Msgn1 transcriptome in differentiating iF-Msgn1 EBs. (A) Hierarchical clustering of differentially expressed mesoderm-associated genes induced by F-Msgn1 (+Dox) for 24 h (P≤0.05; fold change ≥1.5). The color bar represents log2 intensity values. (B) Pathway and tissue expression analysis of all differentially expressed genes (P≤0.05, fold change≥1.5) induced by F-Msgn1 for 24 h. The x-axis shows the P-value (−log10). (C-H) qPCR analysis of select differentially expressed mesoderm genes in iF-Msgn1 EBs treated with (+) or without (−) Dox for 12 h and 24 h. The y-axis shows the normalized fold change. Results are mean±s.e.m.

