Fig. 3.
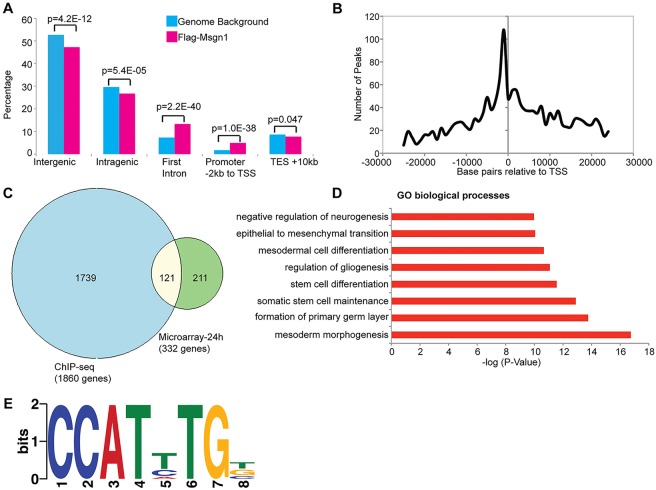
ChIP-seq analysis of iF-Msgn1 EBs. (A) Genomic distribution of 4087 Msgn1 peaks (pink) compared with those from genome background (blue). For genome background, percentages of peaks from random sampling of similar length reads across the genome background are used. A binomial exact test was used to calculate the P-values. TSS, transcription start site; TES, transcription end site. (B) Msgn1 peaks within 25 kb upstream or downstream of the TSS are plotted. (C) Venn diagram depicting the intersection of 1860 genes bound by Msgn1 (blue circle) with 332 differentially expressed genes at the 24-h time point (green circle). The overlap is statistically significant (P≤4.6×10−80, hypergeometric probability test). (D) GO biological processes associated with genes bound by F-Msgn1 and analyzed by GREAT. The x-axis shows the P-value (−log10). (E) Discriminative DNA motif discovery (DREME) analysis of Msgn1 peaks identifies an E-box (underlined), CCATHTGB, as the top motif (E-value=7.6×10–279). The motif logo displays nucleotide conservation at that position (measured in bits) and height of the symbol reflect the relative frequency at that position.

