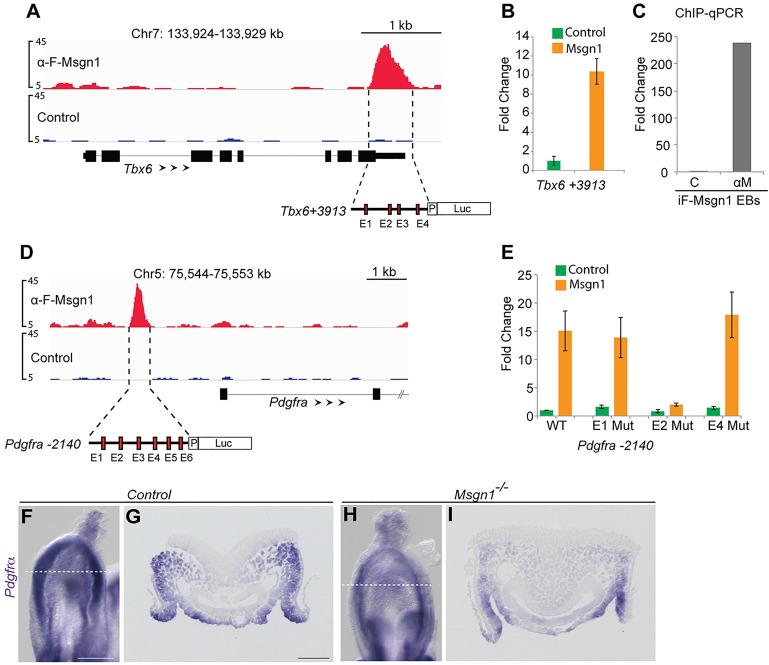
Fig. 4.
The paraxial mesoderm regulators Tbx6 and Pdgfra are direct target genes of Msgn1. (A) Msgn1-binding peaks (red) and input control (blue) at the Tbx6 locus for the indicated genomic intervals (mm9 coordinates). The schematic (below) illustrates the four E-boxes (E1-4, red rectangles) identified in the Tbx6+3913 enhancer peak. Arrowheads reflect gene orientation and the y-axis indicates the peak height corresponding to the normalized fold enrichment. (B) Luciferase reporter assay of Tbx6+3913 enhancer co-transfected with pCS2 Control (green) or pCS2-Msgn1 (orange) expression constructs. The y-axis shows the normalized fold change; error bars show the s.d.; n=3. (C) ChIP-qPCR analysis of F-Msgn1 binding to Tbx6+3913 enhancer using control ‘C’ and anti-Msgn1 ‘αM’ ascites in iF-Msgn1 EBs. (D) Msgn1 binds the Pdgfra locus at −2140 bp, relative to TSS. (E) Luciferase reporter assay of the Pdgfra −2140 wild-type (WT) and E-box mutant enhancers co-transfected with control or Msgn1 expression constructs. The y-axis shows the normalized fold change; error bars show the s.d.; n=3. (F-I) WISH analysis of Pdgfra mRNA expression in control and Msgn1−/− embryos. G and I are cross sections through the PS [dashed white lines in F and H (ventral view)]. Scale bars: 200 μm (F,H), 50 μm (G,I).

