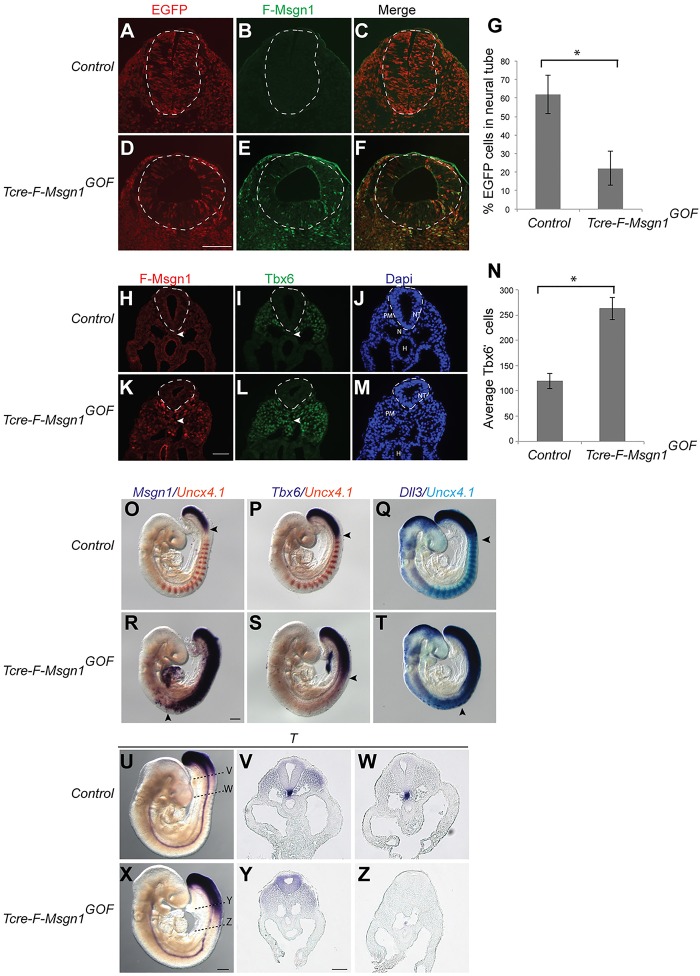
Fig. 7.
Ectopic expression of F-Msgn1 in NM stem cells excludes cells from the neural tube and specifies PSM fates. (A-F) Immunodetection of EGFP (A,D) and F-Msgn1 (B,E) in cross-sections through the trunk neural tube (dashed lines) of E10.5 control (T-Cretg/+; R26-flox-rtTA-Ires-EGFP/+) (A-C) and T-cre-F-Msgn1GOF mutant embryos (T-Cretg/+; R26-flox-rtTA-Ires-EGFP/+; lacZ-TRE-F-Msgn1tg/+) (D-F). (G) Quantitative lineage tracing analysis of T-Cre labeled cells in neural tubes of control (A, n=5) and T-cre-F-Msgn1GOF mutant (D, n=5) are shown. *P≤−2.18×10⁻⁴, two-sample unequal variance Student's t-test. (H-M) Immunodetection of F-Msgn1 and Tbx6 protein in cross-sections through the PSM of E9.5 control (H-J) and Tcre-F-Msgn1GOF mutant (K-M) embryos. NT, neural tube; PM, paraxial mesoderm; N, notochord; H, hindgut. Arrowheads denote the notochord. (N) Quantitative analysis of Tbx6+ cells in control (I, n=5) and Tcre-F-Msgn1GOF mutants (L, n=5). *P≤−7.38×10⁻⁶. (O-T) WISH analysis of Msgn1 (O,R), Tbx6 (P,S) and Dll3 (Q,T), with the posterior somite marker Uncx4.1 (orange in O,P,R and S; blue in Q and T) in E9.5 controls and Tcre-F-Msgn1GOF mutants. (U-Z) WISH of T mRNA expression in control (U-W) and Tcre-F-Msgn1GOF mutants (X-Z). V,W, cross-sections in U and Y; Z, cross-sections in X at the indicated embryonic locations. Scale bars: 100 μm (D,Y), 50 μm (K), 200 μm (R,X).

