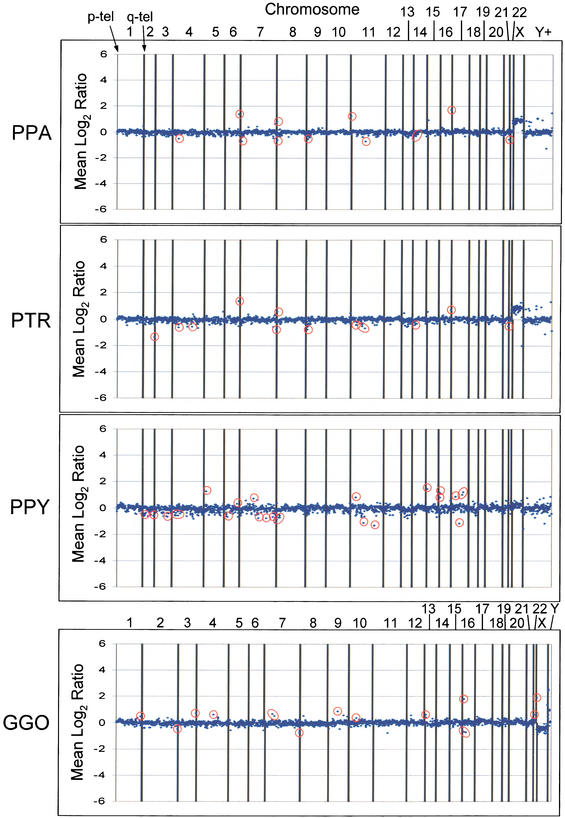
Figure 1.
Examples of the array CGH data. Graphs depicting data for 2460 array loci are presented for a single individual of each species. (PPA) Pan paniscus, (PTR) Pan troglodytes, (GGO) Gorilla gorilla, (PPY) Pongo pygmaeus. Putative variant sites are circled in red. Vertical lines separate the loci from each chromosome, with the p-arm telomere oriented toward the left of each interval and the q-arm telomere toward the right. The Y+ interval contains loci from the Y chromosome in addition to potentially duplicated clones, determined by FISH characterization, and variants in this interval were disregarded for this analysis. Not all variant sites detected in a particular species are represented by the individuals shown. Hybridization of human male reference DNA with female primate DNA or vice versa will yield a constitutive gain or loss for the X chromosome, as seen for the PTR, PPA, and GGO hybridizations. The GGO hybridization depicted here presents data from version 2.0 of the human BAC array, whereas the PTR, PPA, and PPY hybridizations depicted are from version 1.14 of the human BAC array.

