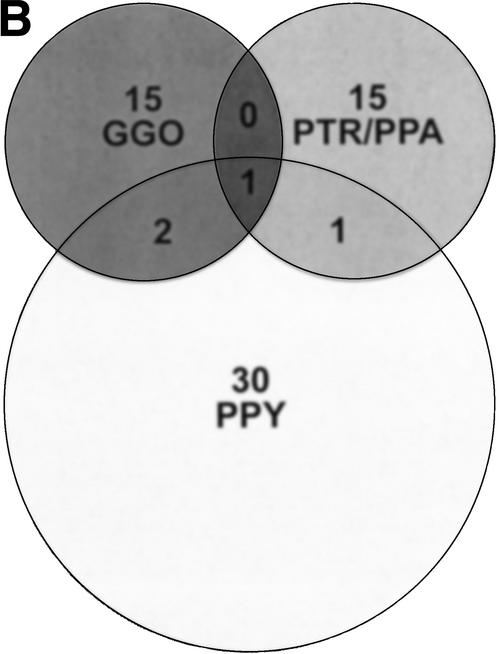
Figure 2.
Sites of great ape/human variation detected by array CGH. (A) A histogram shows the chromosomal distribution of loci detected by array CGH with variant signal intensities consistent with gains and losses of genomic DNA in each great ape species when compared with human. The number of variant sites per 100 Mb is shown for each chromosome. Approximately 12% of the human genome (2460 BAC and PAC clones) was screened by this assay, identifying a total of 63 loci for all species comparisons. (B) A Venn diagram demonstrates that the majority of sites detected by array CGH are specific to each great ape lineage. The number of variant sites per species, PTR and PPA are grouped as they share a majority of variant sites, is shown above the species abbreviation and shared sites are indicated in the respective overlapping regions. The Venn diagram describes 64 rearrangements, yet 63 sites of variation were detected in our analysis. This is due to the fact that one rearrangement site (RP11-88L18) demonstrated a duplication in orangutan and a deletion in gorilla, which are considered separate events. A complete description of each site including Log2 ratio intensity statistics is available (Supplemental Table 1).


